Understanding your smart meter data
This article discusses features only available to customers in the Perth smart water meter program.
For general information about how to view your water use in your online account, see How to check your water use.
In this article
Your smart meter data can provide valuable insights about your property’s water use.
It can help you find and fix leaks earlier, so you can save water and avoid higher bills.
You can view this data at any time within the ‘My water use’ tab in your online account.
Don’t have an online account yet? Register now.
What water use data can I view?
Your smart meter measures your water usage in hourly intervals and automatically sends this data back to us each day.
Your water use data will appear in your online account the following day (24 - 48 hours later).
You can view your water use across any given day, week, month or year.
This data will be available from the time your smart meter joined our network, or when you were registered as the property owner or tenant following this.
You can also compare your water use across different timeframes (e.g. summer compared to winter) and set a custom date range to see your water use patterns.
How is my water use measured?
The water use data available in your online account is measured in litres (L).
Depending on the type of smart meter you have, your meter may display your water use in kilolitres (kL) or cubic meters (m3), but your daily water use is converted into litres in your online account and on your water bill.
It’s helpful to know the below conversions if you’re comparing readings on your smart meter and the water use data in your online account.
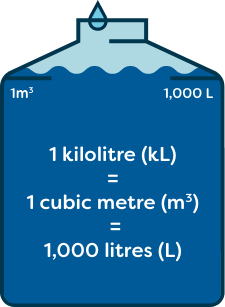
If your water use reaches 9,999L, it will be displayed in the water use graph in kilolitres (kL). You may only ever see this when selecting the year range.
How to read the water use graph
Daily use example

Daily view showing hourly intervals of water use
The blue columns and grey bubbles show how much water you’ve used in litres for the indicated time period.
Columns that show zero usage indicate no water was used during that time. You’d usually see this at night while you’re sleeping or when you’re away from home.
Why is my graph blank on Monday?
When you log in, the graph displays water use for the current week. On Mondays, it may appear empty. This is because Monday’s data won't be ready until the next day. To view your data, adjust the date filter to last week.
Custom date range example
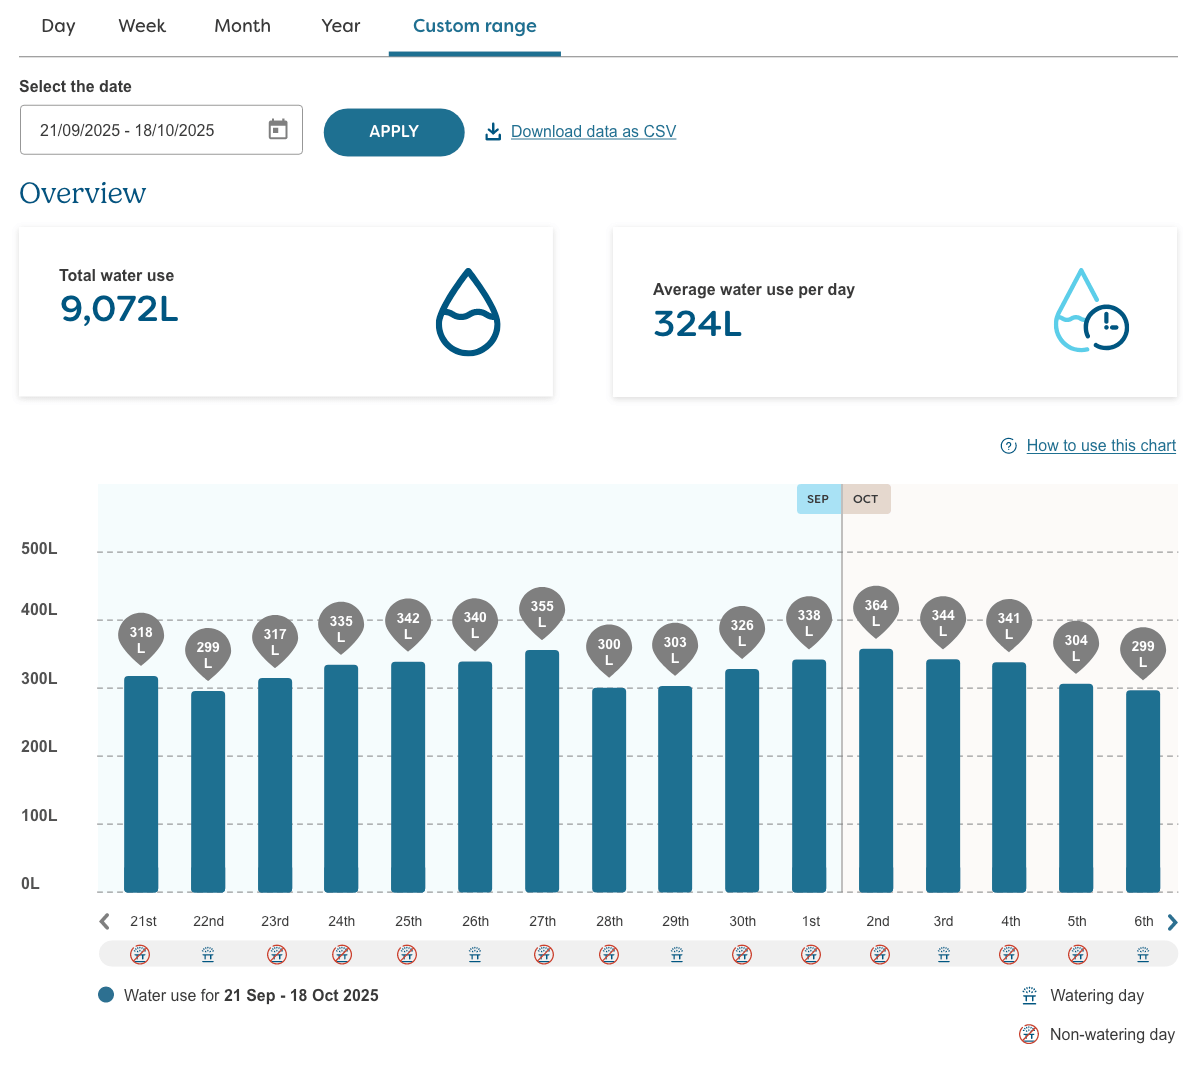
Graph showing water use for the custom date range selected
You can select any date range within 75 days to view your water use. To view your water use beyond 75 days, you can download a CSV file or switch to year view.
How can I check if there’s a potential leak on my property?
We use sophisticated algorithms to identify leaks. If we detect a constant flow (where water has been flowing continuously for an extended period of time), this will indicate to us that you may have a leak.
Any water loss or possible leaks can be seen in the Week, Month, and Year graphs. The amount of water lost is shown in orange, while your normal water use is in blue.
If you hover over each column, you'll see the breakdown of your total water use in litres and how much water you’re losing.
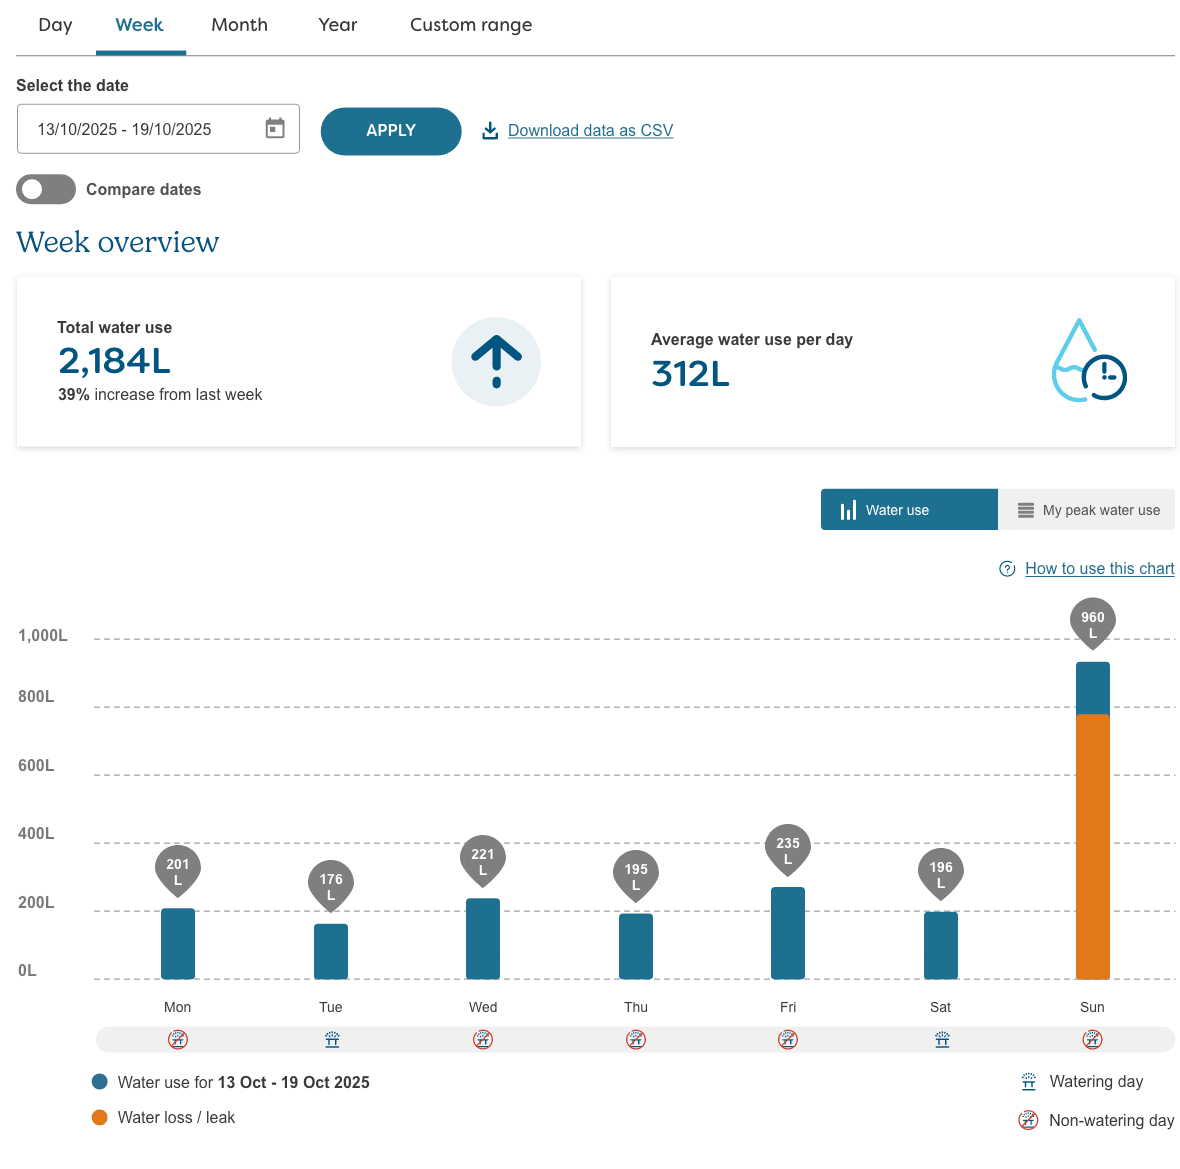
Graph showing a possible leak
Once a leak is repaired, your water use should return to normal, and you’ll no longer see orange columns.
When looking at your hourly usage, you should expect to see your water use drop back to zero at certain times of the day when you’re not using any water.
However, if we still detect that water is constantly flowing, the graph will continue to show that water is being lost, which could mean there may be hidden leaks that need to be investigated.
How to read the peak water use graph
If you select the ‘Week’ view of your water use, you can drill down to see when you use water the most throughout the week.
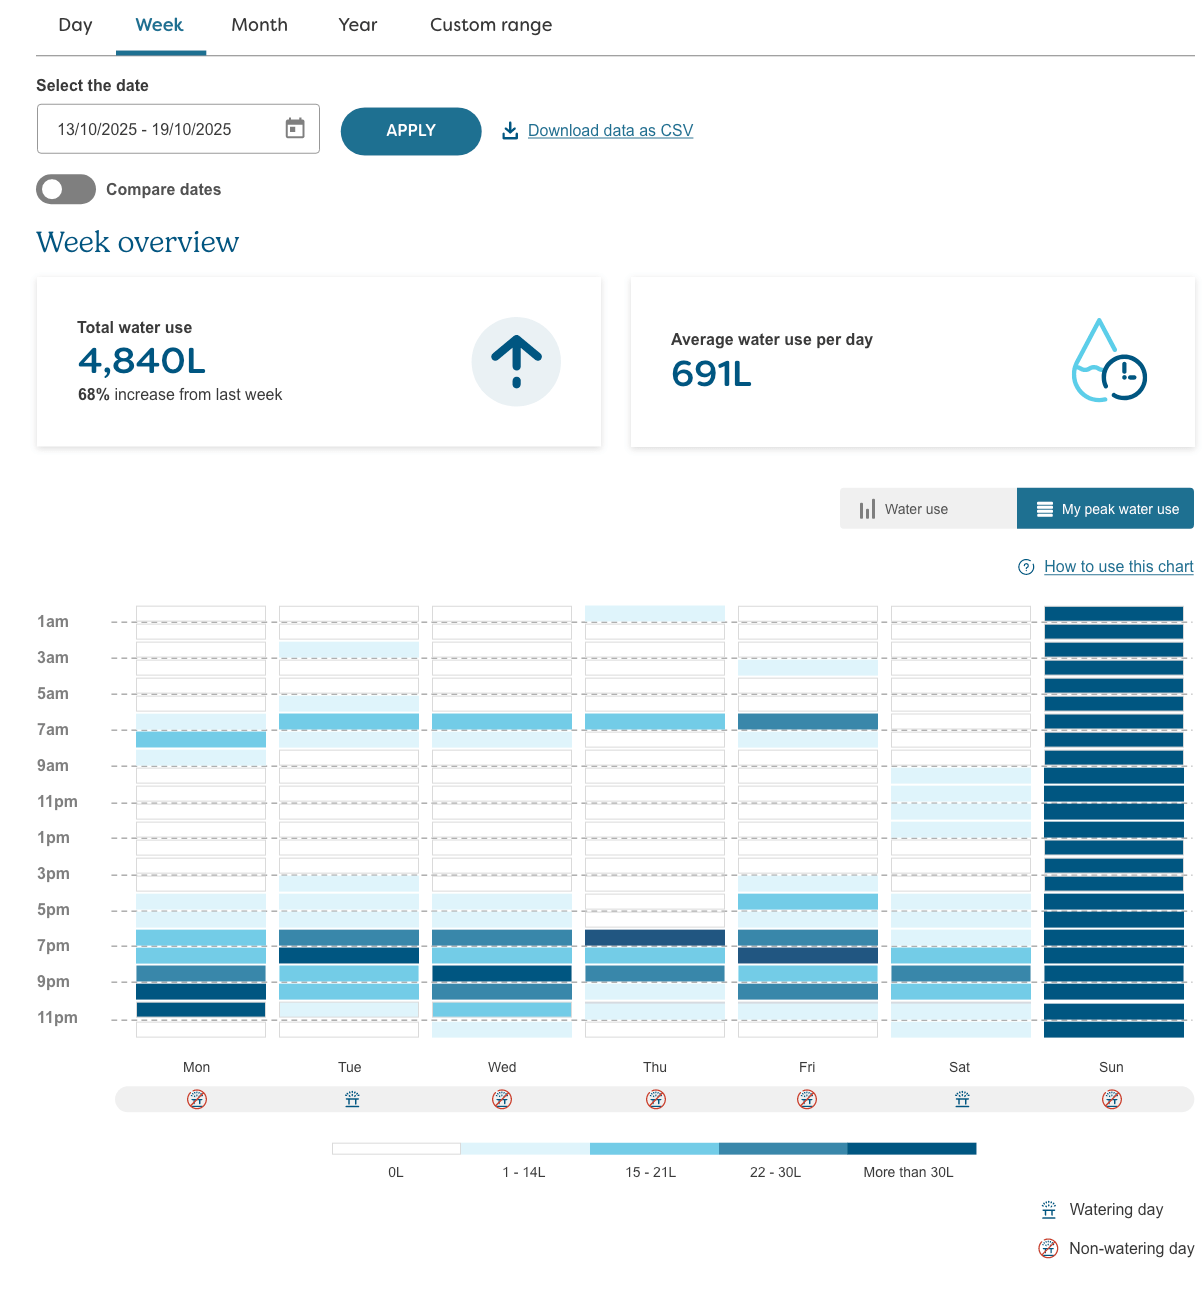
Graph showing peak water use
If your peak water use graph turns completely blue, this means that water has been flowing constantly at your property – which likely indicates that there’s a leak.
Issues viewing your water use data
What does ‘no data available’ mean on the water use graph?
If your water use graph is showing an ‘x’ for a selected time or date, this means we couldn’t retrieve your water use data.
This could be because your smart meter was temporarily offline, or our systems couldn’t connect to your smart meter.
Once we're able to retrieve data again, all water usage that was recorded over this missing time period will show on the graph as having happened in the following hour.
For example, let's say your smart meter goes offline one day from 11am until 2pm.
If the next reading is sent to our systems at 3pm, then all water usage data between 11am - 2pm will be shown on the graph as having occurred at 3pm.
This is why you may sometimes see an unusual 'spike' in your hourly water usage, following a period of missing data.
If your hourly water use data comes through within the next 7 days, the graph will automatically update to show the actual water use per hour.
I can’t see any of my water use data
Sometimes, unexpected connection issues can happen. You'll see an error message where your water use data would normally be displayed.
When this happens, we'll work to restore the connection as soon as possible and in most cases your water use data will return.
My meter is offline, will I still get my water use data?
If your meter is offline or broken and not working, you won’t be able to view any water use data in your online account. The data will become available again when your meter is back up and running.
If your meter is still able to record your usage, we’ll send a meter reader to read it manually.
However, if your meter is physically damaged and not recording your water use at all, please let us know by calling 13 13 75.
We’ll replace your meter as soon as possible and estimate your water use for the missing period, based on your previous usage.
Learn more about estimated meter readings.