.jpg?rev=96dc640314b741779eff2a7365a1d606&la=en&hash=128D4FFED42A950B8B0B7D975C153FC2)
Wet winter belies true impact of declining streamflow to Perth dams
With recent rainfall across Perth and southern WA, it’s easy to assume our dams are full to brim. But the connection between rainfall and dam levels isn’t so simple.
Read moreWe produce many media statements throughout the year reflecting aspects of our diverse business. On this page, you will find all of our media statements for the past five years. For older statements, please contact media@watercorporation.com.au.
.jpg?rev=96dc640314b741779eff2a7365a1d606&la=en&hash=128D4FFED42A950B8B0B7D975C153FC2)
With recent rainfall across Perth and southern WA, it’s easy to assume our dams are full to brim. But the connection between rainfall and dam levels isn’t so simple.
Read moreWater Corporation is urging Perth households to get back to the basics of being waterwise in a new campaign, with data revealing an increase in residential water use.

Nanarup has been chosen as the site for the proposed small‑scale seawater desalination plant, a vital project that will secure the Lower Great Southern region's water future and support its continued growth.

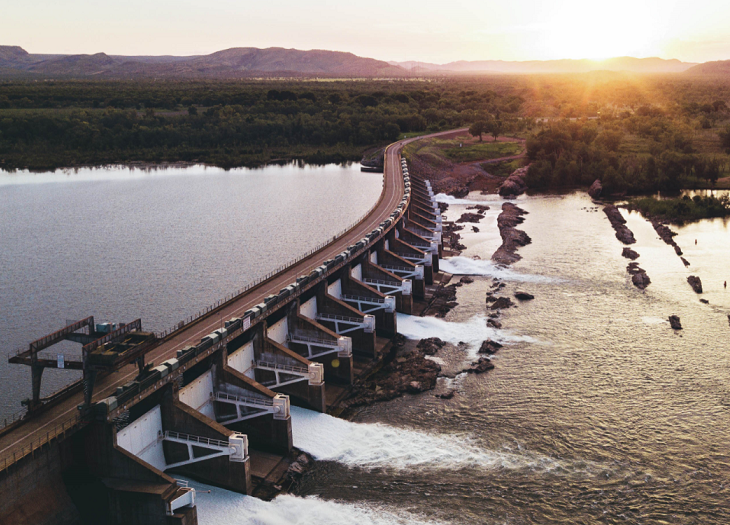
Water Corporation will be lowering the water level of Lake Kununurra this wet season to complete important maintenance work to the irrigation scheme.

Two influential leaders with decades of experience in governance, infrastructure, and public policy have been appointed to Water Corporation’s Board.

Collie residents are being urged to rethink what goes down household toilets and sinks after several large blockages were recently cleared from the town’s wastewater network.

For media queries during office hours 8.30am – 5pm AWST, Mon - Fri please call 9420 2555.
Media contacts